Table of Contents
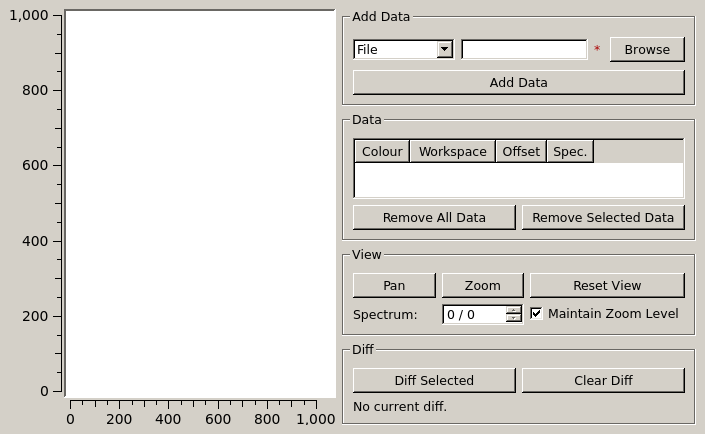
The data comparison interface provides a method of comparing the spectra of multiple MatrixWorkspace (either pre loaded into Mantid or loaded via the interface its self) using a preview plot.
Note that data in this plot is not normalised to bin width as it is by default in Mantid plot windows, to reduce plotting artefacts you may want to consider running ConvertToDistribution prior to loading the data into the UI.
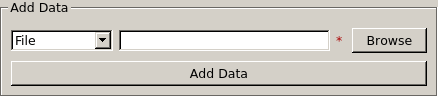
This allows new data to be added to the comparison, this can be added by either selecting a MatrixWorkspace already loaded into Mantid or by selecting a file to load.
Alternatively you can select a WorkspaceGroup to load it’s contents into the UI.
Once the data has been selected the Add Data button can be used to add it to the comparison, this will add a curve to the preview plot and assign it the next unused colour for the curve (if all are in use then black will be used).
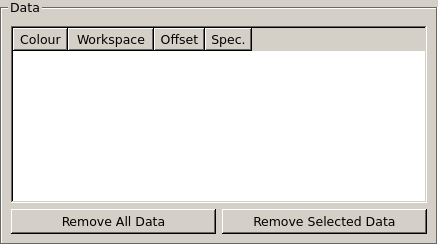
The data table shows a list of the current data shown on the plot including the workspace name and currently plotted workspace index. This also allows the curve colour to be changed manually.
This also allows a workspace index offset to be set on a per workspace basis, this allows workspaces to be aligned relative to each other in the venet that the spectra that you want to compare do not have the same workspace index in each workspace.
The value of the offset for a workspace defines the workspace index that the first spectrum will line up to relative to the spectrum selection spin box. At least one offset value must be zero (this is set check for automatically after an offset value has been changed).

The view section contains a set of tools for manipulating the plot and selecting spectra to plot via the Spectrum spin box, this is shown as the current workspace index out of the maximum workspace index after the offsets are applied.
The Pan and Zoom buttons are usd to enable and disable the pan and zoom tools; pan allows you to drag the plot area to show a specific section of the curves, zoom allows you to select a section of the curves to zoom in on and reset the zoom level by right clicking on the plot, when either tool is selected you can use the scroll wheel to change the zoom level when the mouse is over the plot area.
The Maintain Zoom Level option is used to keep the same pan and zoom settings when switching between spectra and adding new data, when this is disabled the plot will automatically be resized such that all curves are visible on the plot. This can also be done manually by clicking the Reset View button.
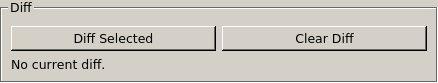
A diff spectra of two workspaces can be created by selecting two workspaces in the data table (by holding Ctrl whilst making a selection) and clicking the Diff Selected button, this will subtract the current spectra for the second workspace selected from the current spectra for the first spectra selected and plot the result spectra as a green curve on the plot.
If either of the diff workspaces are removed then the diff will be cleared. If one of the workspaces can no longer be displayed as it is offset from the other workspace then a message will be displayed in the diff tool and no plot will be shown, however the diff will continue to function once both workspaces can be displayed again.
The diff workspace is created by running ExtractSignleSpectrum on the two data workspaces, the second of which is then rebinned to match the binning of the first using RebinToWorkspace and then using Minus to calculate the difference.
Note that if the two diffed workspaces have different binning, then the second one selected will be rebinned to match the first before the diff is created. This will not modify the data in the original workspace.
Categories: Interfaces | General